FREE
Trading • 11 min read •

How to Read Candlestick Charts & Technical Indicators for Beginners

Demystify Japanese candlesticks, bullish and bearish reversals, moving averages, and Relative Strength Index (RSI) for smarter trade execution.

T
TradeCostPro Research Desk

Fintech Analyst & Quantitative Researcher

Share:
Green and red candlestick trading charts and technical price action analysis
Practical manual for reading price action, support-resistance zones, RSI, and exponential moving averages.
Table of Contents

Originating in 18th-century Japanese rice markets through legendary trader Munehisa Homma, candlestick charts remain the most intuitive and powerful visualization of buyer and seller psychology in modern capital markets.
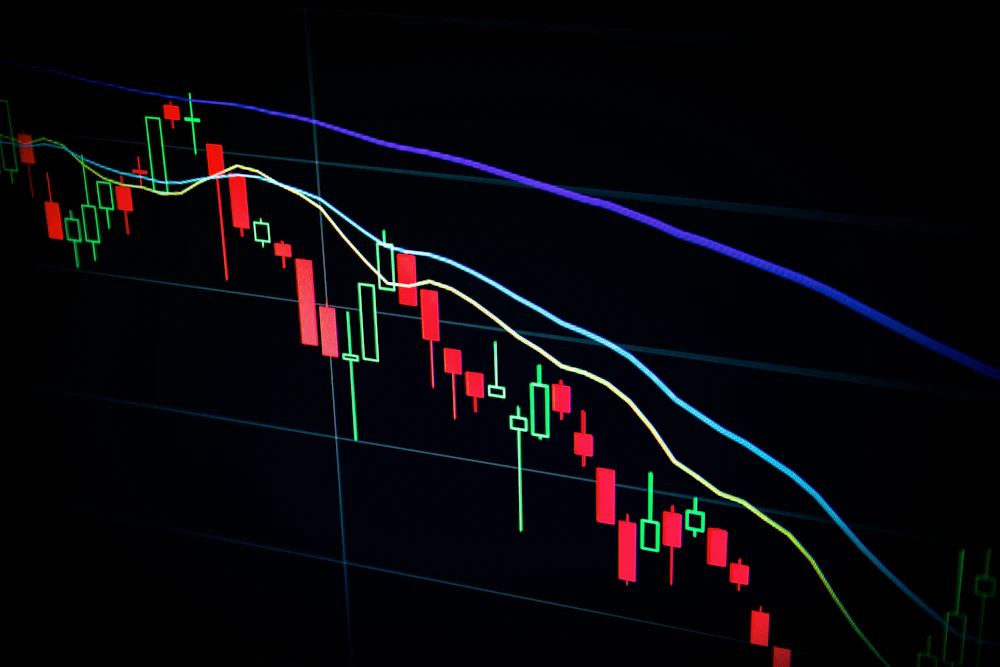
Trading screens showing real-time price action indicators RSI and moving average convergence
Figure 7.1: Multi-timeframe candlestick chart showing trend channels and volume spikes Technical Analysis

Anatomy of a Candlestick: Open, High, Low, Close (OHLC)

Each candle tells a story of auction dynamics over a specified timeframe:

  • The Real Body: Represents the price distance between the Open and Close. A green body signals buyers dominated the session, while red signals aggressive seller liquidation.
  • The Upper Wick (Shadow): The highest price reached during the period. Long upper wicks indicate that buyers attempted to push higher but were rejected by supply.
  • The Lower Wick: The lowest price reached. Long lower wicks (e.g. Hammer patterns) signal that sellers drove prices down, but institutional dip-buyers absorbed all liquidity.

The Golden Rule: Never Trade a Candlestick in Isolation

A hammer or bullish engulfing candle on random noise is meaningless. The same pattern forming precisely at an established horizontal support level with a surging volume histogram provides an institutional high-probability setup.

Institutional trading floor monitors displaying market depth and volume flow
Figure 7.2: Combining volume confirmation with technical indicators prevents false breakouts Volume Confluence

3 Essential Indicators Every Beginner Should Master

  1. 20-Day and 50-Day Exponential Moving Averages (EMA): Dynamic trend filters. When price trades above the 20 EMA, the short-term momentum is bullish.
  2. Relative Strength Index (RSI): A momentum oscillator ranging between 0 and 100. Readings above 70 indicate overbought conditions, while readings below 30 indicate oversold territories. Look for RSI divergences where price makes a lower low but RSI forms a higher low.
  3. Volume Weighted Average Price (VWAP): The benchmark price institutional algorithms use to execute large block orders without slippage.
Sponsored Recommendation

Standardize Unstructured Bank Statement PDFs

Auto-detect salary credits, duplicate transactions, and balance reconciliations.

Convert Free Now →

Frequently Asked Questions

2 Questions Answered
Q What are the four core components of a candlestick?
Every candlestick records Open, High, Low, and Close (OHLC) for a specific timeframe (e.g., 5-minute, hourly, or daily).
Q What is an RSI overbought and oversold level?
Relative Strength Index (RSI) scales from 0 to 100. Traditionally, an RSI reading above 70 indicates an overbought condition, while an RSI below 30 signals oversold levels.

Editorial Sources & Regulatory References

Fact-Checked

TradeCostPro editorial publications adhere to institutional auditing standards, citing verified regulatory frameworks, central bank master directions, and statutory compliance guidelines.

T
TradeCostPro Research Desk Author

The TradeCostPro Research Desk provides data-driven financial explainers, banking algorithm breakdowns, and tax compliance guides for finance professionals.

Financial & Investment Disclaimer:

All content published on TradeCostPro is intended solely for educational, research, and informational purposes. None of the materials or calculations constitute personal investment, financial, legal, or tax advice. Consult a certified financial planner (CFP) or chartered accountant before executing major investment or borrowing decisions.

Suggested Articles & Related Reading

Article link copied to clipboard!